

The NHS in England took another step closer to breaching 18 weeks, as new waiting list figures showed an unprecedented January increase in the number waiting. Since referral-to-treatment records began in 2007, the waiting list has shrunk every January by at least 26,000. This January it rose instead by some 20,183.
That brings the English waiting list to 2,900,340 patients, plus perhaps another 60,000 at the three Trusts who did not report data. Last month I predicted the list would pass the psychological 3 million mark in the March or April figures; March is now the most likely month though February has also entered the race (we’ll find out when the February figures are released next month).
How big can the waiting list get before 18 weeks is breached nationally? That is very hard to say, but bigger than 3 million anyway. Nevertheless, January’s unexpected rise in the number waiting has only increased the risk that 18 weeks will be breached nationally this year.
One year waits slipped again, a little, but we don’t know the true picture because there are likely to be plenty more one-year-waiters among the Trusts who did not report data. Nevertheless the picture on one year waits remains good compared with last year.
In the following analysis, all figures come from NHS England. If you have a national statistic that you’d like to check up on, you can download our Gooroo NHS waiting times fact checker
England-wide picture
Waiting lists were up again, which is unprecedented for a January.
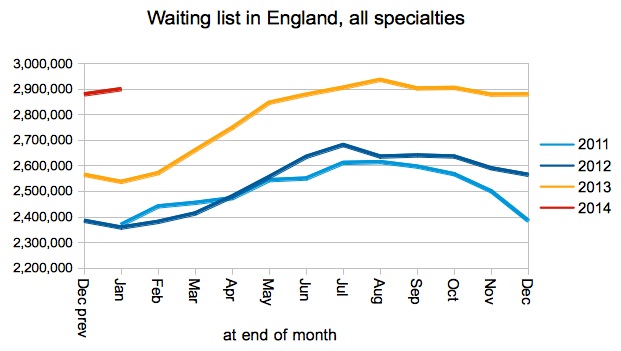
Waiting list in England
Admissions per working day were a little higher than in recent years. The increase is welcome and needed, but the growing waiting list suggests that it is far from enough.
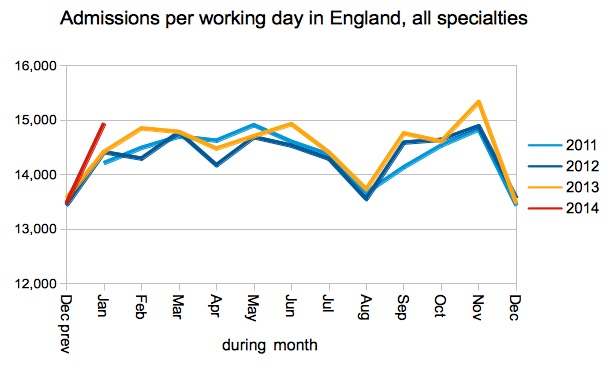
Admissions per working day
The number of very long waiters ticked up in January, but these figures omit three Trusts who may have quite a few long-waiters between them. The increase should not obscure the fact that one-year-waiters remain historically very low.
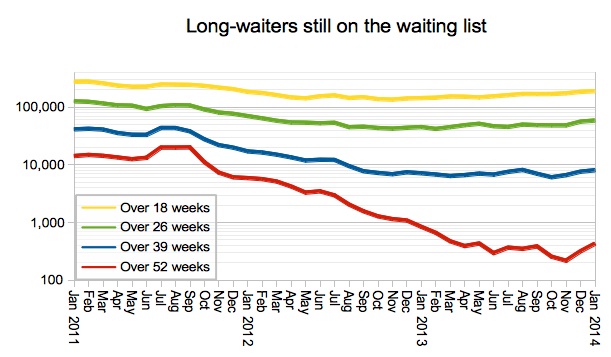
Long-waiters on the waiting list
The target is that 92 per cent of the waiting list should be within 18 weeks, and nationally the NHS is creeping steadily closer to that line.
Trusts responded by treating more long-waiting patients (which is the right thing to do), and as a result the proportion of admitted patients who had waited less than 18 weeks fell to 90.4 per cent, barely above the (perverse) older target that requires at least 90 per cent of admitted patients to be short waiters.
As more Trusts breach 18 weeks, the 90 per cent target makes it unnecessarily difficult for them to treat their longest-waiting patients and recover. So, ironically, the original 18 week target is now one of the pressures pushing the English NHS towards failure.
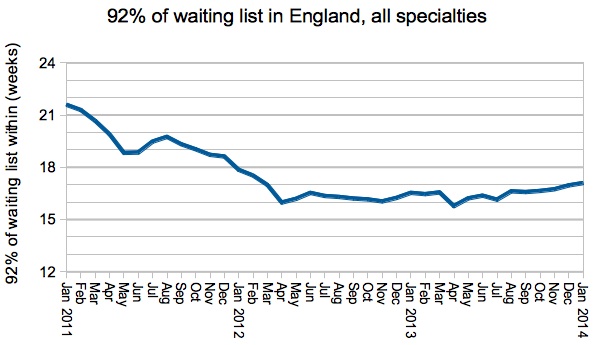
92pc of waiting list within
The two big specialties that recently failed against the 18 weeks target – General Surgery and Orthopaedics – slid further into breach territory, with Urology threatening to join them.
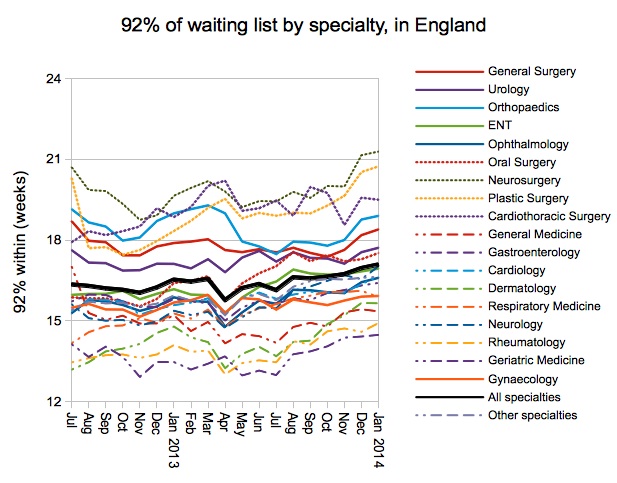
92pc of waiting list by specialty
Every specialty in every Trust is supposed to achieve ’92 per cent of the waiting list within 18 weeks’, but the proportion that actually do is starting to slide.
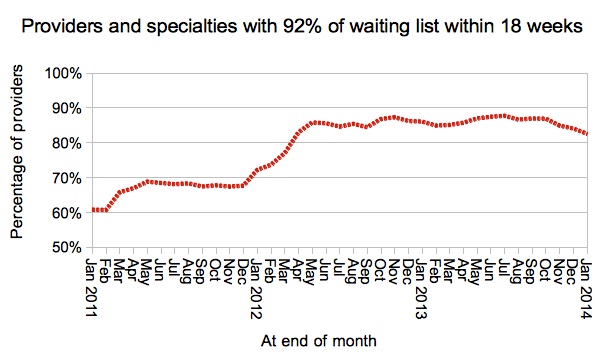
Provider-specialties achieving 92pc within 18 weeks
The next chart is new: it shows the distribution of 92 per cent waits for every specialty’s waiting list at every provider (excluding the tiddlers). The point where the red line crosses 18 weeks in the chart below is the same as the proportion plotted in the chart above.
The shadowy grey lines, which you can see peeping out from below the red line, show what the distribution looked like a month and a year ago. The whole curve has lifted only a fraction, but there has been more movement at the right hand end. This shows that, where services are breaching 18 weeks, they are now breaching by a slightly wider margin; this might be exacerbated by the ’90 per cent admitted patient’ target trapping services in breach territory by restricting their ability to treat long-waiters.
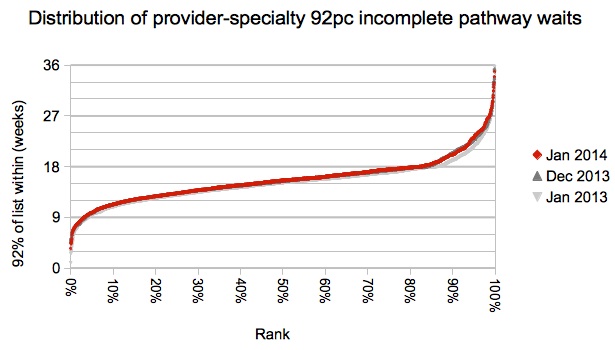
Distribution of provider-specialties
Provider top twenty
Very little movement at the top of the table this month, although there has been more jostling further down with some Trusts appearing on the table from nowhere and others dropping out.
44 Trusts reported any one year waiters, up from only 33 in December, which is an unwelcome decline. A further 9 independent sector providers reported one year waiters, up from 3.
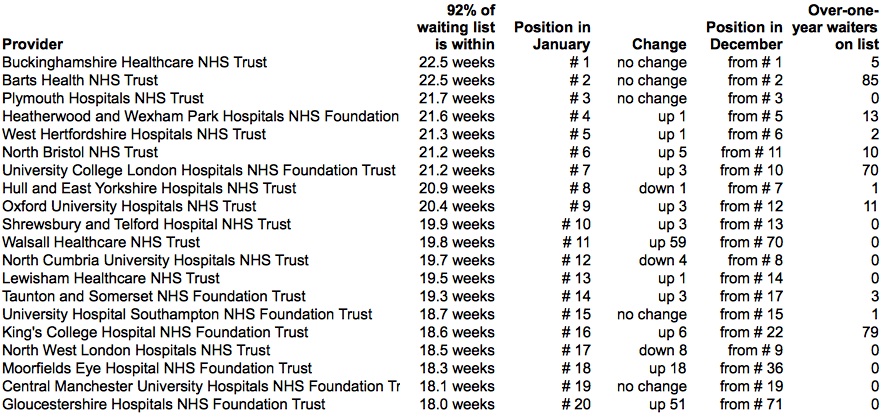
Top twenty
Circle Reading made a brief appearance at 4th position in December’s table, and they have now dropped back out to 87th place in January.
The February 2014 data is due out at 9:30am on Thursday 17 April 2014.