

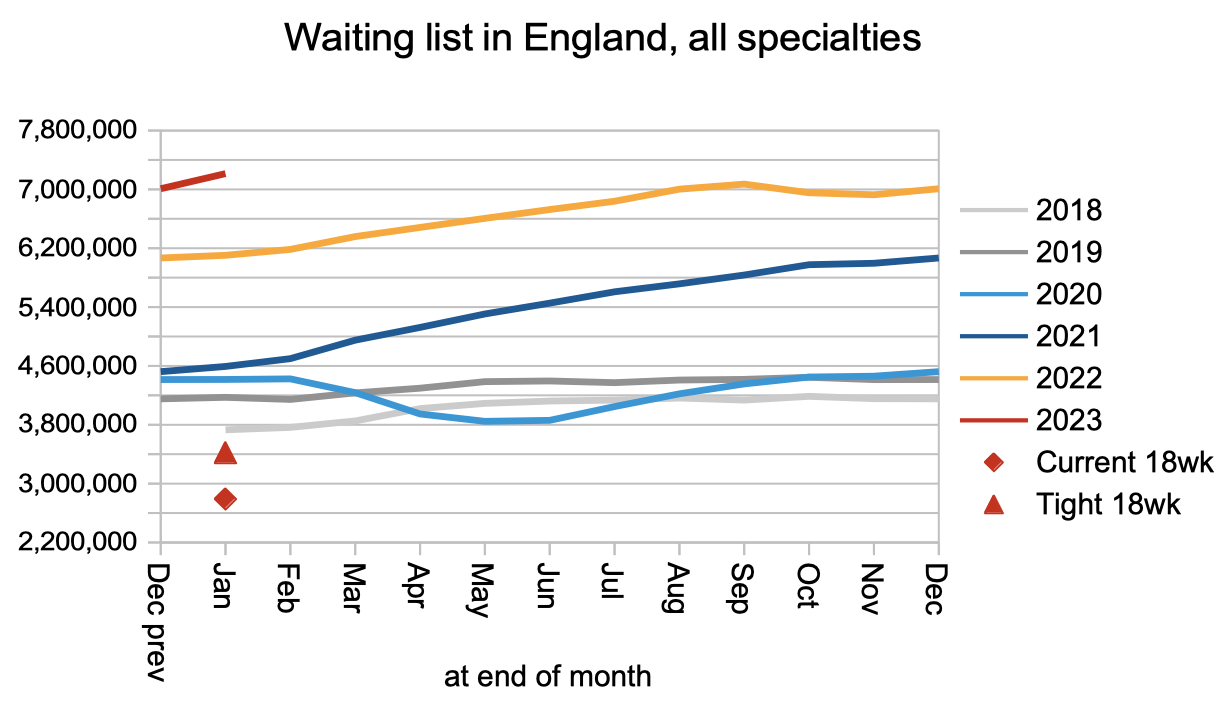
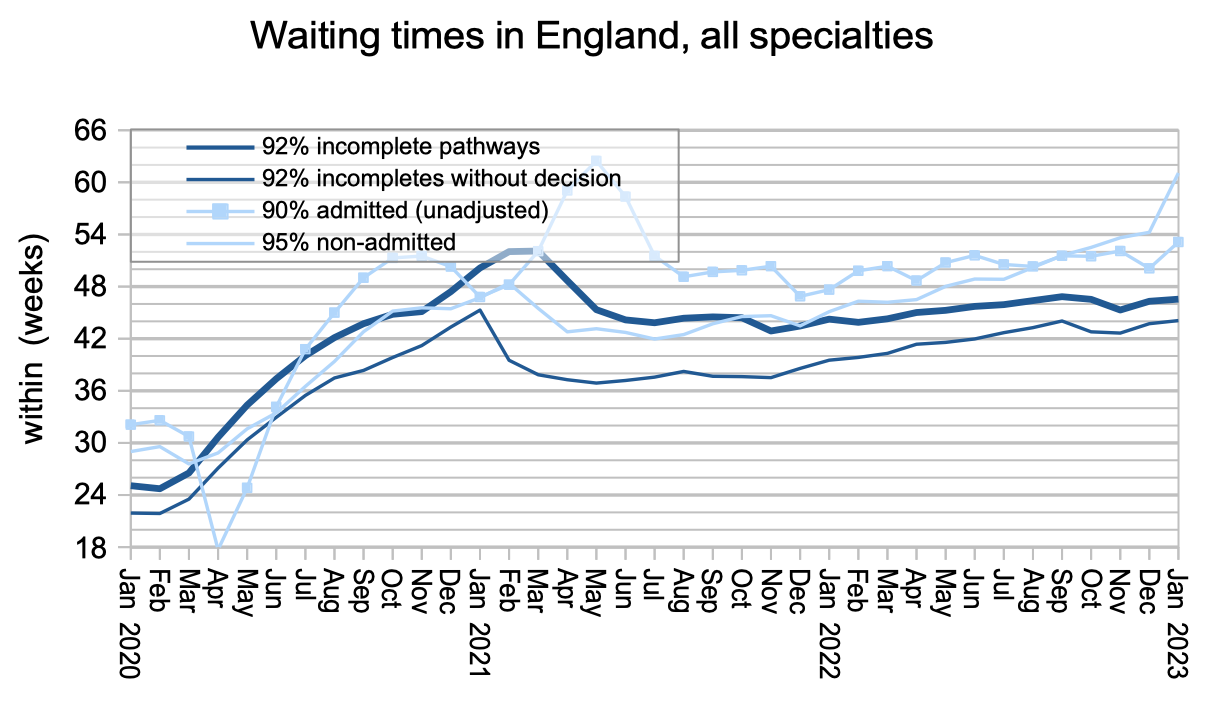
The referral-to-treatment (RTT) waiting list narrowly broke through previous records in January, edging up to 7,213,436 patient pathways. Waiting times rose too, with eight per cent of the list waiting longer than 46.6 weeks, up from 46.3 weeks the previous month.
Analysis produced for Health Service Journal by Dr Rob Findlay, Director of Strategic Solutions at Insource Ltd and founder of Gooroo Ltd
The large majority of those patient pathways – 6.1 million – did not have a decison to admit, and most would not have reached diagnosis. Eight per cent of the 6.1 million were waiting longer than 44.1 weeks, which is over 10 months. And when they eventually get their diagnoses, it will unexpectedly turn out to be cancer for an estimated 26,000 of them. There are currently no government waiting time targets aimed at reducing these long waits for diagnosis and decision.
There are however targets in other areas. At the end of January, 1,122 patients were waiting longer than 104 weeks, despite the target to eliminate such long waits by July last year. And there were 45,631 patients waiting longer than 78 weeks, with a target to eliminate those waits by April this year. There is some question about the accuracy of these figures, following (possibly unlawful) government guidance that some of those patients can be removed from the published figures, but unpublished Freedom of Information requests suggest that few trusts have implemented the new guidance so the long-wait numbers may not be significantly distorted by it.
In this discussion, all figures come from NHS England. For analysis of waiting times performance at a particular organisation, visit our reports page, or our map of the latest elective waiting times across England.
The numbers
All of the charts below are based on the published numbers, without any adjustment for non-reporting trusts. The changes during January are affected by Manchester University NHS Foundation Trust resuming RTT reporting, and this is the cause of most of the month-on-month increases seen below. The good news is that all acute trusts are now reporting RTT data again.
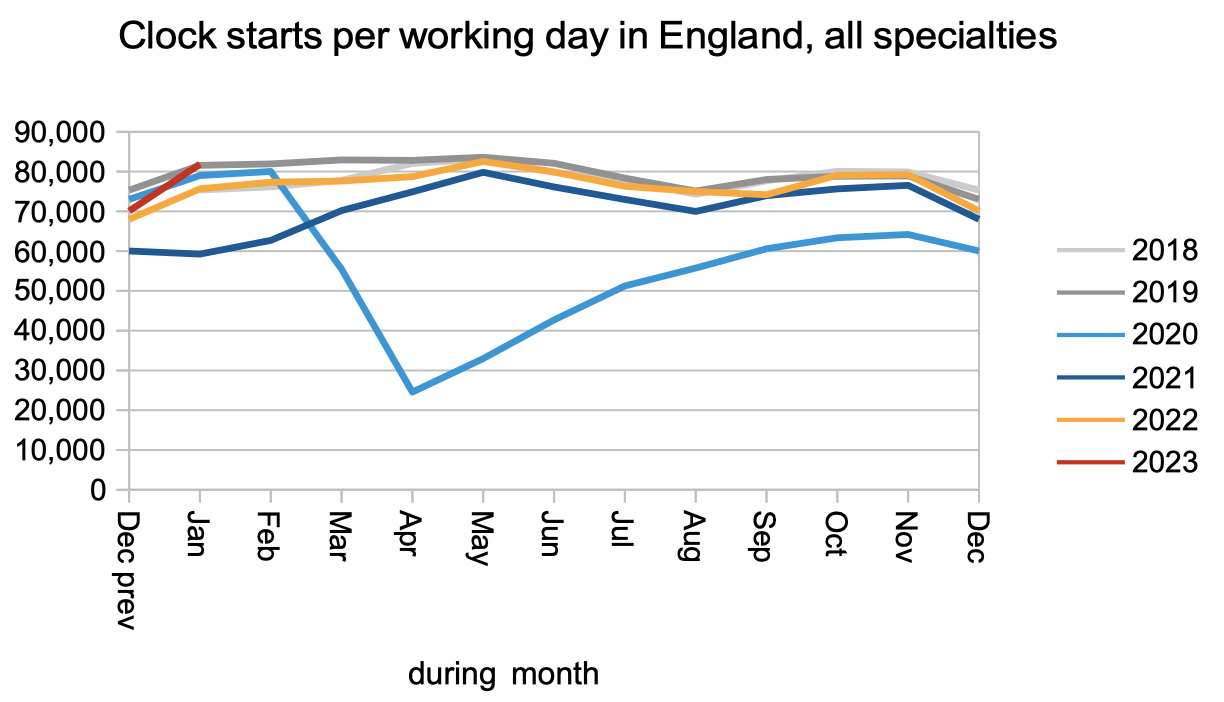
Demand (as measured by the number of patients starting new waiting time ‘clocks’) was at pre-pandemic levels.
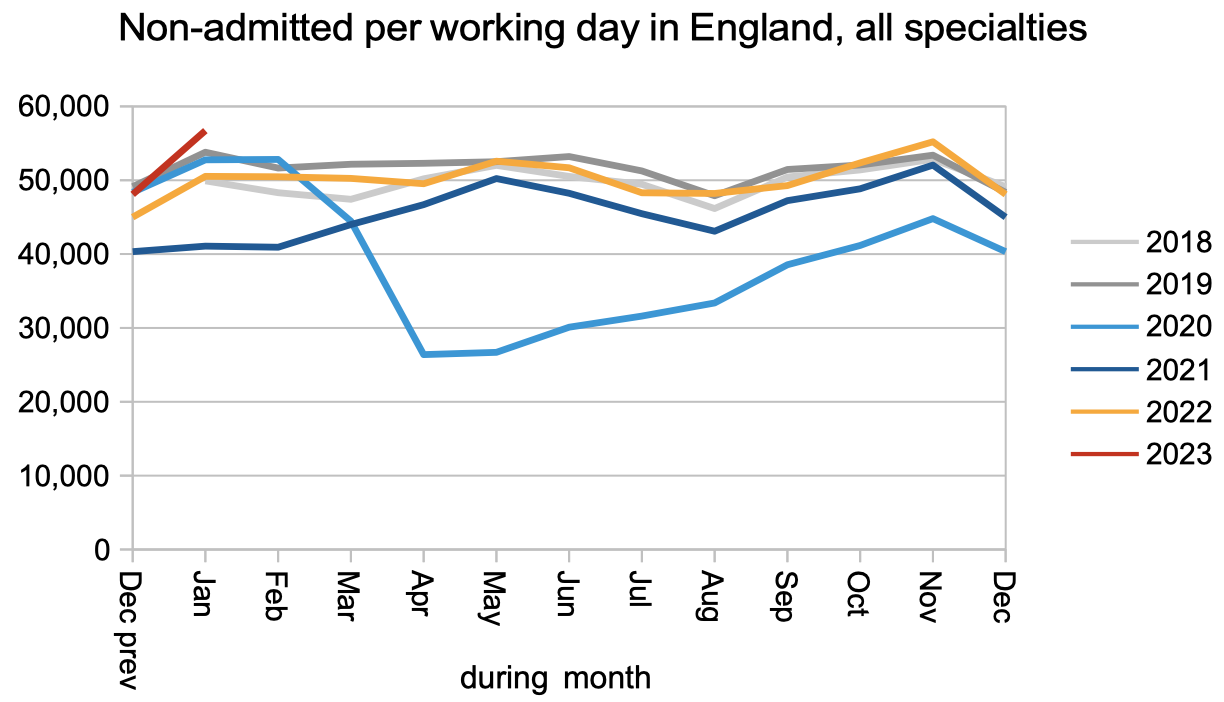
Non-admitted activity (patients discharged from clinic or otherwise removed from the waiting list) was above pre-pandemic levels.
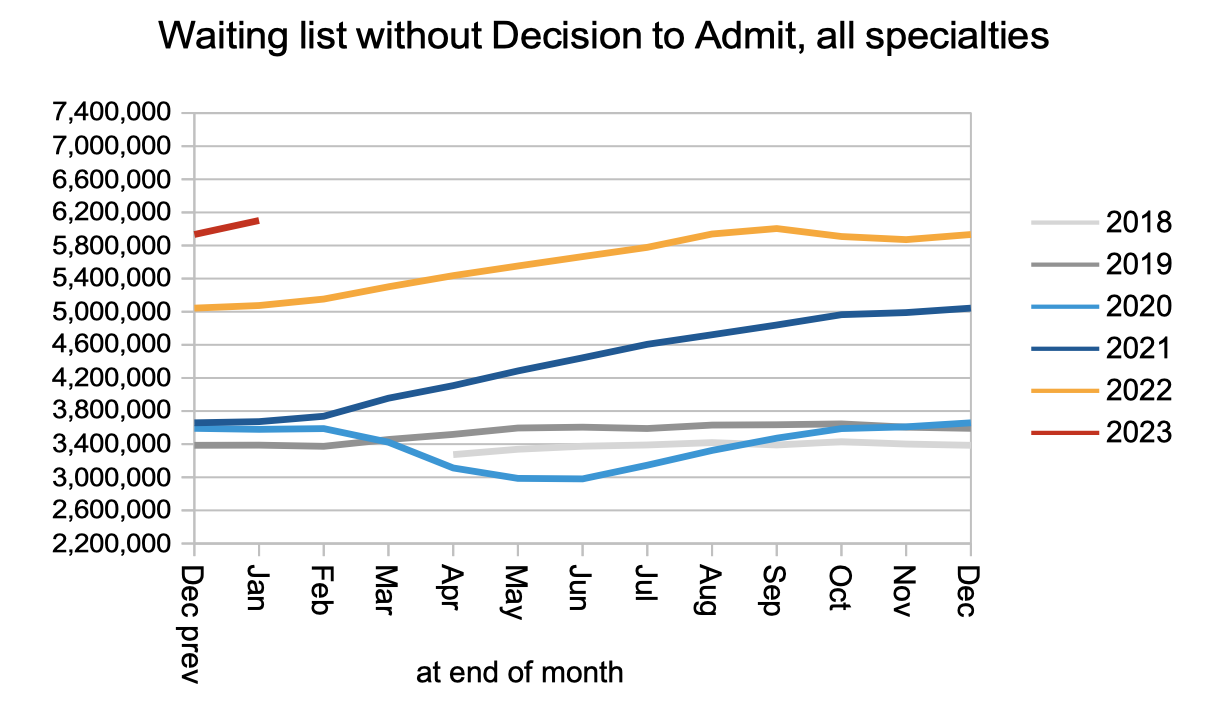
The number of patients on the waiting list without a decision to admit, most of whom are pre-diagnosis, rose rapidly during the pandemic. The apparent increase in January is caused by Manchester University NHS Foundation Trust resuming reporting.
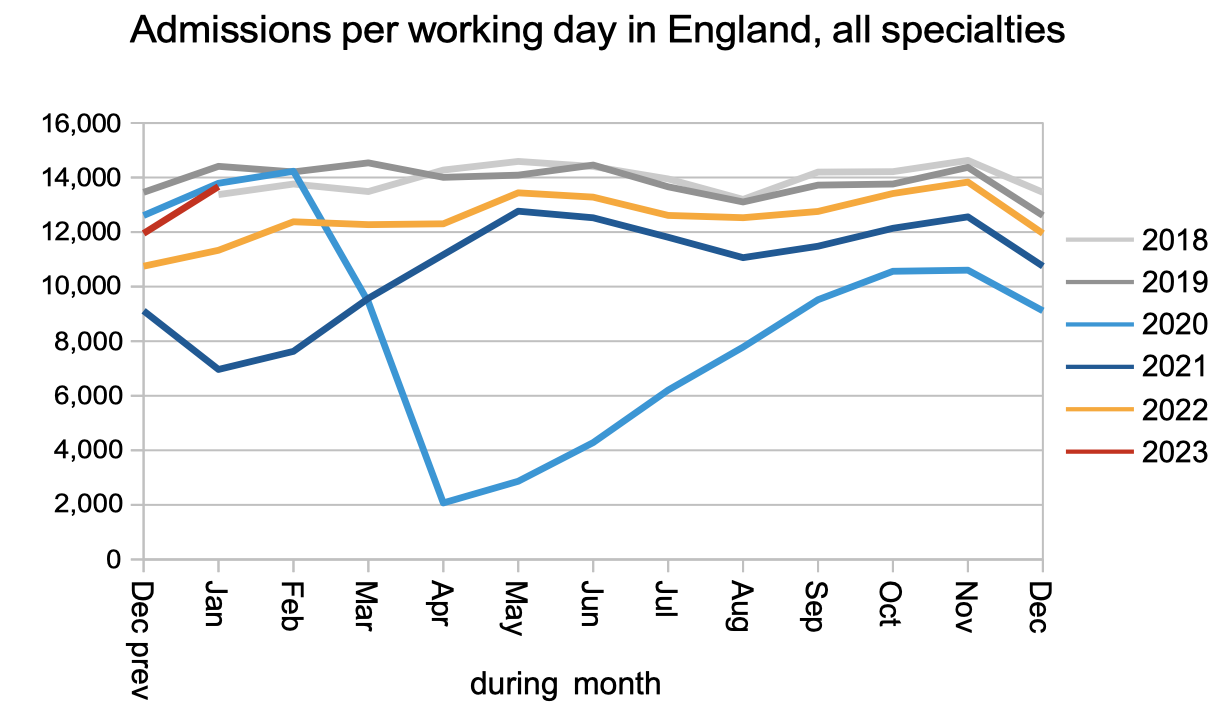
The rate that patients were admitted for inpatient or daycase treatment remained at or below pre-pandemic levels.
The apparent increase in the overall RTT waiting list in January, which includes patients both with and without a decision to admit, is again caused by Manchester University NHS Foundation Trust resuming reporting.
Waiting times have been roughly flat in recent months, though they remain much longer than pre-pandemic, and very much longer than the 18 week target which is still legally in force. As noted above, the very long wait for diagnosis and decision is a cause of clinical risk on the waiting list.
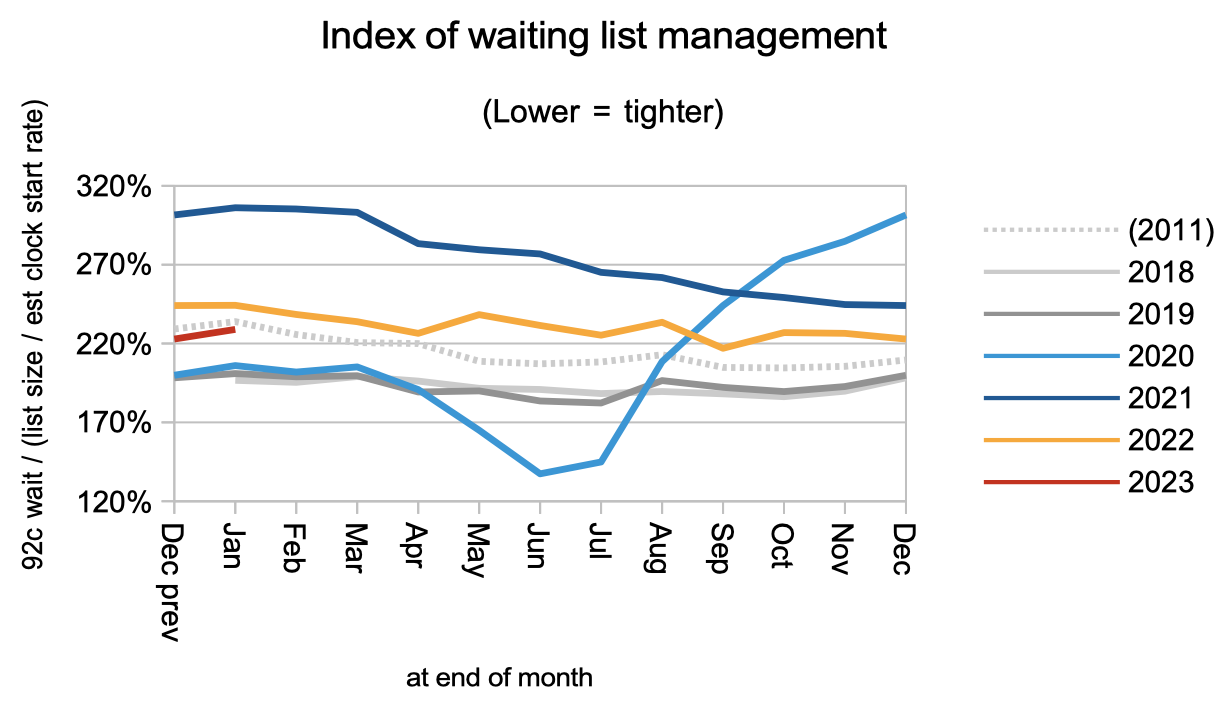
Waiting times are a function of both the size and shape of the waiting list, and the next chart shows that the shape is still at 2011 levels and remains significantly worse than pre-pandemic.
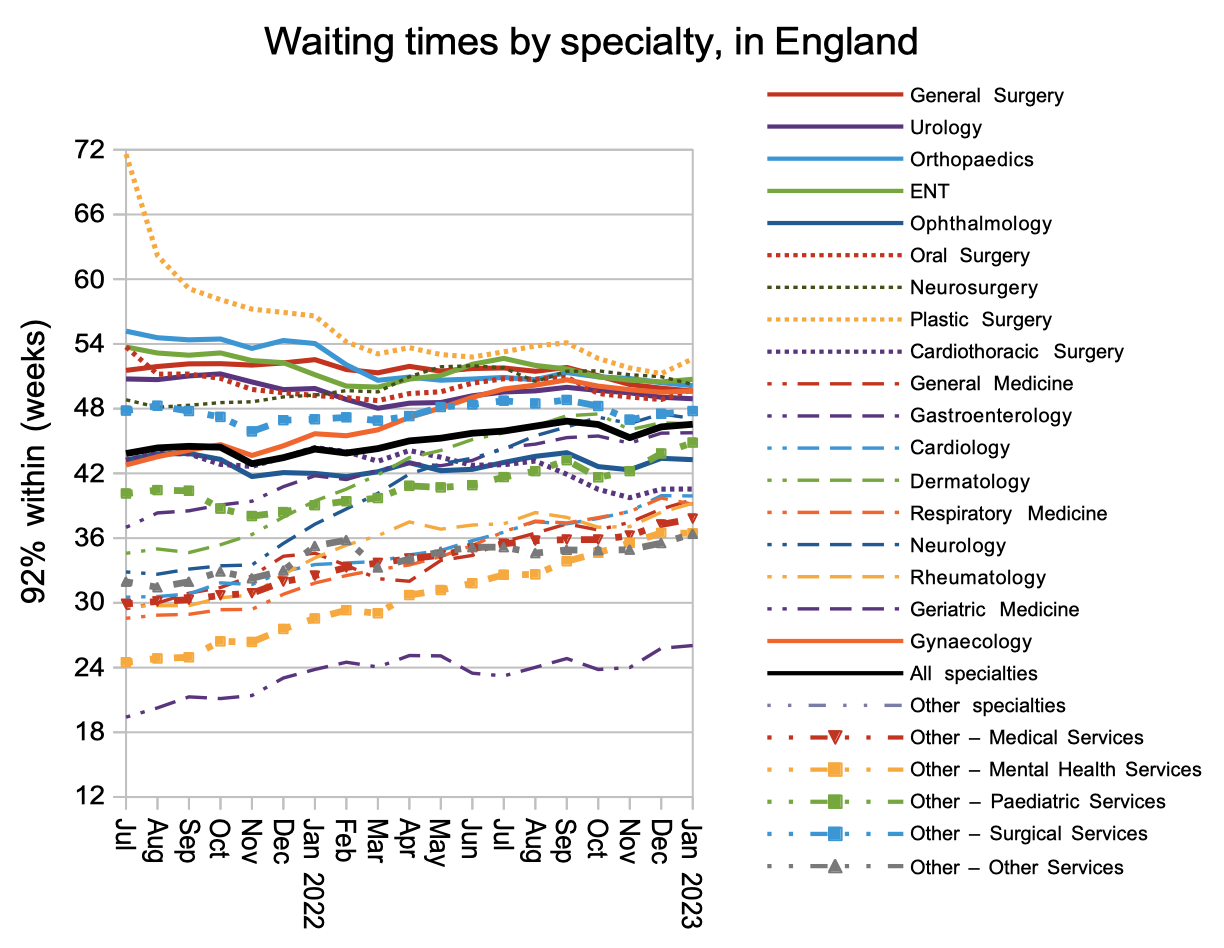
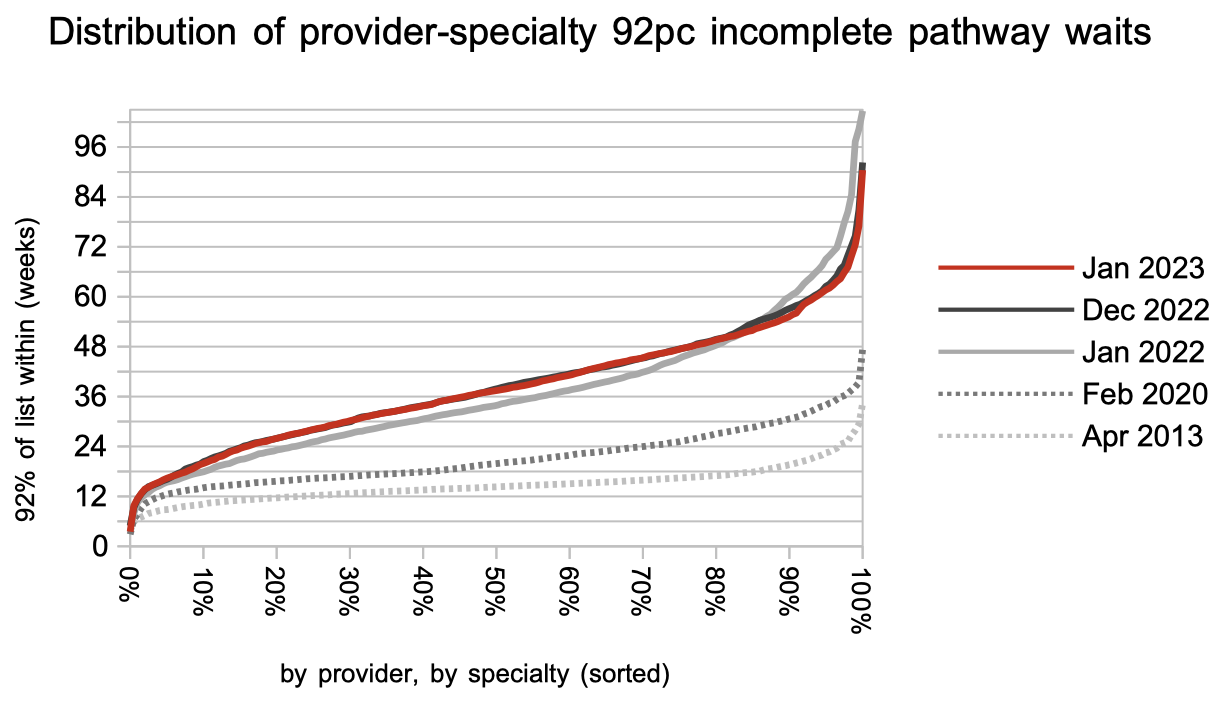
Waiting times at specialty level continue to converge, with shorter-waiting specialties experiencing growing waiting times, while longer-waiting specialties improve in response to the targets.
The national-level charts above average-out the variation between one local hospital service and another, and this local variation is brought out in the next chart. Over the last year, waiting times have generally been rising while the very longest waits come down in response to the targets, and waiting times remain much longer across the board than in 2013.
Referral-to-treatment data up to the end of February is due out at 9:30am on Thursday 13th April.