The waiting times targets for cancer services are complex, reflecting the multi-stage clinical pathways that patients follow from referral, through various stages of diagnosis, to their eventual treatment or discharge.
Hospitals need to be able to plan and manage these pathways. They need to know how much capacity to lay on, so that they can keep up with the demand for cancer care and sustain short enough waiting times. And they need to know the sustainable waiting list size at each stage of the pathway, so they can spot when any of the queues are getting too big.
In short, hospitals need a planning model for cancer pathways.
The NHS does not provide one centrally. Indeed NHS Improvement argue that modelling all stages of the cancer pathway together is not feasible – we beg to differ.
Gooroo Planner is already built to model demand, capacity and waiting times dynamically along multi-stage clinical pathways, so it is well placed to handle cancer pathways too. In this blog post we will outline how to approach the task, and illustrate how entire cancer pathways can be modelled in detail using a worked example for prostate cancer.
Describing the clinical pathway
Every tumour site has its own clinical pathway, and those pathways may differ from hospital to hospital. So the first step is to understand the particular cancer pathway that you want to model.
For instance you might describe a prostate cancer pathway like this:
- referral to cancer service;
- first outpatient appointment;
- biopsy of primary tumour;
- follow-up outpatient appointment;
- screening for metastases – several tests may be done if initial tests are inconclusive;
- multi-disciplinary team meeting;
- follow-up appointment (at which a decision to treat may be made);
- first definitive treatment – several options.
That’s quite a pathway when it comes to modelling, so the next step is to make sure we don’t over-complicate things. We need to identify where there are significant waits, and where there aren’t, because if there is no need to model waiting times for some bits of the pathway then we can save ourselves quite a lot of data preparation.
Modelling the pathway
In the pathway above, for instance, we definitely want to model the waiting time from referral to first outpatient, because it is a significant wait and covered by the “two week wait” target.
We also need to model the wait from “decision to treat”, to the start of definitive treatment, which is covered by the 31 day target.
There is also the overarching 62 day referral to treatment target, which means that we need to account for other significant waits along the pathway (in particular, screening for metastases).
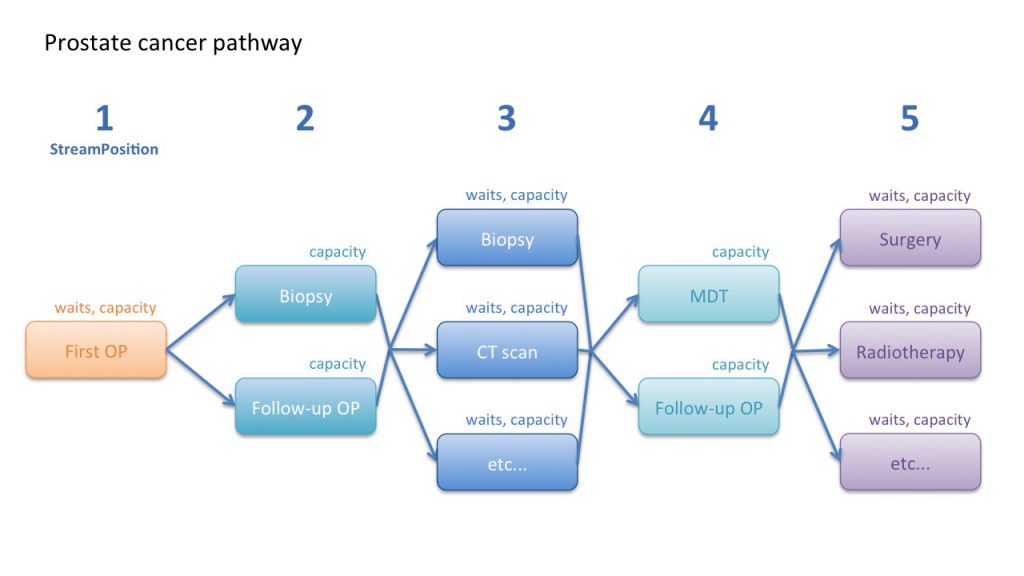
So our example prostate cancer pathway could be modelled according to the following pathway map:
You will notice that not all stages of the pathway have waits attached, and that some stages without waits have been put in parallel with each other. Let’s go through the pathway step by step to understand why, following the “StreamPosition” (stage of pathway) numbering in the map above.
1) First outpatient
The two week waiting time target from referral to first outpatient appointment is straightforward to model. If there are any subdivisions of urgency within this casemix, we can take them into account by providing the proportion and safe waiting time for those patients. Gooroo Planner will then use this data to calculate the sustainable waiting list size, and the recurring and non-recurring activity needed to achieve it.
We can also provide performance data about clinic utilisation and time per patient (or let Gooroo Planner measure it automatically from patient level data, if available) so that the model can calculate the clinic capacity necessary to keep up with demand and clear any backlog.
2) Biopsy and follow-up
After the first outpatient appointment a primary tumour biopsy is usually taken, which is subsequently reported on. Then the patient attends a follow-up clinic to discuss the results.
It would be possible to model the biopsy and the follow-up clinic sequentially, with waiting times for each. But in this example we can simplify the model by putting these steps in parallel and without waiting times, because the biopsy and follow-up happen very quickly and there is no scope to build up a waiting list. So the biopsy and follow-up are modelled as non-waiting list services, and the model will automatically calculate the activity needed to keep up with demand.
We can also provide performance data such as time per patient and capacity utilisation for these three activities (taking the biopsy sample, reporting on it, and following up with the patient) so that the model can calculate the week-by-week capacity needed for each.
3) Testing for metastases
Patients with a confirmed diagnosis of prostate cancer are then offered diagnostic tests for metastases.
This is the most complex part of the pathway because there are several possible tests, and if the results of any particular test are inconclusive then the patient is offered another. And it is important to model the time taken to complete metastatic screening, because this takes up a large part of the overarching 62-day referral-to-treatment cancer waiting times target.
In the real-life service that this example is based on, most patients have only one or two metastatic tests and very few have more than three. On that basis we can simplify this part of the modelling as follows:
a) Make an assumption that there is a two week period available for completing all metastatic tests. Most patients only require one or two tests, so we can allow a waiting time of one week for completing each test. Patients who require more than two tests are then classified as urgent for the third and subsequent tests, and sufficient urgent capacity is carved out by the model to ensure they can complete those tests very quickly.
b) This means there is no need to model the first, second, third, etc tests sequentially, or model all the possible combinations. We can simply allow the model to calculate the demand and capacity for each kind of test, allowing a maximum one week wait for each test (and a much shorter wait for the minority who have already had two or more tests). This approach to modelling also reflects how the services work in real life in this example. This data will allow Gooroo Planner to calculate the maximum sustainable waiting list size for each kind of test, which is the early warning trigger when pressures are building up.
c) In this example we are assuming that, after each kind of metastatic test, there is a similar conversion rate onwards to the next stage of the pathway. However if examination of the data shows that this is not the case, we can easily reflect that in the model by weighting the conversion rates accordingly.
d) Finally, for each kind of test we can feed in performance data for both the test time and the reporting time, so that the model can work out the different kinds of capacity needed.
4) Multidisciplinary team and decision to treat
The results of the metastatic tests are reviewed by a multidisciplinary team, and then the patient attends a follow-up clinic to discuss the results and consider a decision to treat. Both of these need to take place quickly, so (as at step 2 above) we can model them in parallel without a waiting list, and provide performance data to allow the model to calculate capacity.
5) Treatment
Finally, those patients who require treatment are placed on the waiting list for surgery, radiotherapy, or whichever other treatment they need. This stage of treatment has its own waiting time target of 31 days, and as always the model automatically measures the conversion rate, so this is straightforward to model taking into account different levels of clinical urgency and capacity requirements.
Patients who had three or more metastatic tests can also be classified as urgent, in which case the model will dedicate capacity for them to ensure that their lengthy diagnostic phase is compensated for by swifter treatment.
Other benefits of modelling cancer pathways
Modelling isn’t just a number-crunching exercise, it also provides insights into the management and pressures of the system. For instance you might find that:
- waiting lists are already too large in the earlier parts of the clinical pathway, and when those services reduce their lists to a sustainable level there is much less “fire-fighting” to keep within the 62-day target at the treatment stage;
- some parts of the service are using waiting list initiatives and temporary capacity inappropriately, at high marginal cost, to make up for shortfalls in their recurring capacity – resolving this will result in lower costs and a better service to patients;
- patient-level simulation of the metastatic diagnostic services may show a high level of disruption when patients have three or more diagnostic tests – when this aspect of Gooroo Planner is shared with consultant medical staff, they may choose to redesign the process so that far fewer patients require more than two tests, reducing the capacity required.
An example dataset
To show how easily this prostate cancer pathway can be modelled in Gooroo Planner, here is an example of a working dataset for modelling demand, activity and waiting times. Capacity is easily added by including performance data for beds, theatres and clinics.
The fields are decoded in the Gooroo Planner documentation, and the ones above are:
- HeadType: the activity type or point of delivery – every step of the pathway is separately identified.
- HeadUnit: a general purpose field, used here for the anatomical cancer site. You can include as many cancer pathways as you like in a single model (and even model the rest of the hospital alongside).
- StreamPosition: the stage of pathway, corresponding to the diagram above.
- PastNonWLActiv: non-waiting list activity in the past period (e.g. last 12 months) – this is used where a step in the pathway is being modelled as non-waiting list, so that activity simply keeps up with demand.
- PastWLActiv: waiting list activity in the past period – used where a step of the pathway is modelled as a waiting list, in which case all the following fields are populated as well.
- PastAdd: the number of patients added to the waiting list for this step of the pathway during the past period.
- PastWLStart and PastWLEnd: the size of the waiting list for this step of the pathway, at the start and end of the past period – a growing waiting list is a sign that activity has not kept up with demand.
- FutWaitTime1 and FutPCWaiting1: if some of these patients are more urgent than others, these fields can be used to expedite the most urgent by stating their safe time limit and the proportion who can wait longer – for instance in the metastatic testing at StreamPosition 3, 80 per cent of patients have only one or two tests, but the remaining 20 per cent have three or more and must be expedited through their later tests in just one-third of a week.
- TgtMaxWait, TgtMaxWaitPC and TgtMaxWaitType: the waiting time target that applies at each stage of the pathway – for instance at the treatment stage, the target is that 94 per cent of patients must be treated within 31 days (we have put 4 weeks to allow a small margin), and this target is based on counting patients as they flow (TgtMaxWaitType = f) through the process.
Support
We will be happy to support any hospital wanting to model cancer pathways using Gooroo Planner.
If you already have a Gooroo Planner Professional licence then you already have access to unlimited remote support – just email us at [email protected].
If you don’t yet have a licence then we would be happy to demonstrate Gooroo to you – just contact us to request a free on-site demo.

