

Follow-up outpatients, also known as repeat or return outpatients, are important because they are time-limited – they can (and sometimes do) come to avoidable harm if their appointments are delayed. Effectively they are clinical priorities, and hospitals need to plan enough capacity to make sure they are consistently seen on time.
But although the NHS is accustomed to planning against waiting times for first outpatients, the same is not generally true for follow-ups. Their waits tend to be less visible. But that does not mean it cannot be done, or that it is necessarily difficult. So how do we do it?
The starting point is to recognise that (in capacity planning terms) there are two main types of follow-up outpatient, and each needs to be modelled in a slightly different way. They are: chronic disease populations; and follow-ups within the clinical pathway.
Chronic disease populations
Follow-up outpatients with chronic conditions need to be followed-up indefinitely, and examples would be patients with wet AMD or diabetes. The workload for the follow-up service depends on the population of these patients, which may grow or shrink over long timescales as patients join and leave it, but its size is not much affected by short-term variations in new outpatient activity.
This means that chronic disease follow-ups can be modelled as stand-alone services, which makes things simpler.
In Gooroo Planner: chronic disease follow-ups can be
modelled as stand-alone services, with StreamPosition = 0
If all is going well, a chronic disease service may tick over nicely without any patients being delayed and without significant changes in the number waiting. This is as straightforward as it gets: just set the service up in Gooroo Planner as a non-waiting list service that is not part of a clinical pathway (just like an emergency service).
But what happens if follow-up waiting times have stretched, and some patients are waiting longer than they should? We could model these follow-ups as a full-blown waiting list service, which is the most careful way but it’s somewhat laborious when it comes to preparing the data. Fortunately there is a simpler alternative.
Gooroo Planner provides two data fields to describe one-off changes in demand, and we can use these to do the job. (Like all the data fields, they are explained in the Gooroo Planner documentation.)
“FutExtraDem” allows a one-off dollop of extra demand to be thrown into the future period (i.e. the period we are modelling), and we can use this to add a waiting list initiative for clearing overdue follow-ups. So if (say) 30 follow-up patients are currently overdue, then we can set FutExtraDem = 30 which has the effect of increasing the future activity required by that amount.
In Gooroo Planner: for the follow-up service,
FutExtraDem = latest count of overdue follow-ups
That takes care of the overdue patients, but there is something else we need to watch out for. If a backlog of overdue follow-ups has been building up, then activity has probably not been keeping up with demand. We need to take account of that too, otherwise activity may continue to fall short of demand and the backlog will just grow back again (a common problem with NHS waiting lists generally).
How should we account for this shortfall in activity? If we were modelling a waiting list service such as first outpatients, Gooroo Planner would do it automatically by taking account of the growth in the waiting list. But in this case we are modelling follow-ups as a non-waiting list service, so there is no waiting list data for the model to use in its demand calculations. What can we do instead?
This is where the field “PastExtraDem” comes in handy – it allows a dollop of extra demand to be thrown into the past period.
So for this follow-up service, we would set PastExtraDem to the increase in the number of follow-up patients waiting (i.e. the number waiting for follow-up appointments at the end of our past period, minus the number waiting at the start). Note that we are talking here about the total number of patients waiting for follow-up appointments, not just those who are overdue. And the “increase” might turn out to be a decrease if the waiting list got smaller, so this number can be negative.
In Gooroo Planner: for the follow-up service,
PastExtraDem = total number of follow-ups waiting at the end of the past period,
minus number at the start
And that, for chronic disease follow-ups, is that.
Follow-ups within the clinical pathway
The second type of follow-up takes place as part of a clinical pathway. For example there are two such follow-ups in this surgical pathway:
first outpatient ⇒ diagnostic test ⇒ follow-up ⇒ surgery ⇒ follow-up
Demand at each stage of the pathway depends directly on activity at the preceding stage and the conversion rate. So these follow-ups are definitely not stand-alone. How can model all this straightforwardly?
Let’s start with the follow-ups themselves. We can use FutExtraDem to reflect overdue follow-ups, and and PastExtraDem to reflect growth in the follow-up waiting list, just as we did in the chronic disease situation above.
Then we have the pathway to take care of. It is possible to model the whole pathway directly in Gooroo Planner, in which case the model will work out all the knock-on effects automatically. But describing a complex pathway can be rather fiddly (especially when only a minority of patients follow the diagnostic loop) so it would be helpful to have a simpler alternative. Fortunately there is a way.
For modelling purposes, we can simplify the clinical pathway so that first outpatients are the first step in the pathway and everything else is together at the next step. Then the knock-on effects of any changes in first outpatients will feed through to all the subsequent stages in the pathway including follow-ups – after all, they were all first outpatients once. So that takes care of the knock-on effects of extra first outpatients.
In Gooroo Planner: simplify modelling along a clinical pathway by putting
first outpatients at StreamPosition = 1,
and everything else at StreamPosition = 2
That just leaves the knock-on effects of extra follow-up activity on later stages of the real clinical pathway. We can capture these by using FutExtraDem, but this time we apply it to services that are downstream of the follow-ups.
For instance if we are planning extra activity of 30 follow-ups to eliminate the overdue backlog, and the number of follow-ups who were waiting decreased by 100 in the past period (i.e. an ‘increase’ of -100), then we would expect to see a total of 30 – 100 = -70 ‘extra’ (i.e. 70 fewer) follow-ups in the future. Then if we expect about 20 per cent of them to convert to daycases, then -70 * 20% = -14 will convert. So we can set FutExtraDem = -14 for the daycase service.
In Gooroo Planner: for services after follow-ups in the pathway,
FutExtraDem = estimated extra knock-on demand arising from the follow-up service
A worked example
Let’s run these numbers through Gooroo Planner.
First, here are the numbers going into the model – what we call the ‘dataset’. The dataset includes all the numbers from the description above, together with an additional 5 per cent trend demand growth to show how it can be done.
Both the past and future periods have been set to exactly one year long to keep the numbers easy to follow, and the clinical pathway example has been kept to just three stages for simplicity. The dataset going into the model is:

And here are the results coming out of the model, based on keeping up with demand:
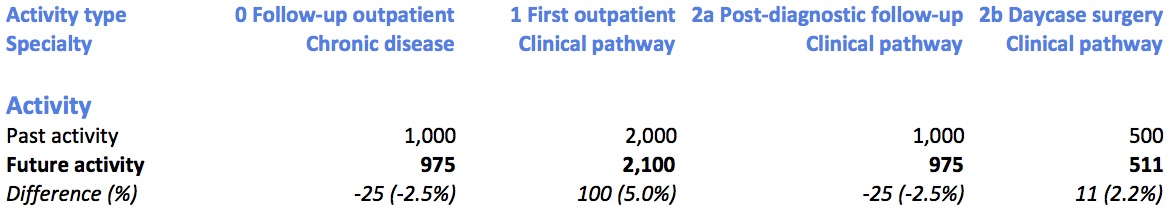
Looking at the chronic disease service, the future activity needed to keep up with demand is:
(1000 past activity – 100 change in list size) + 5% growth + 30 backlog clearance
= (1000 – 100) * 1.05 + 30
= 975
Turning to the clinical pathway scenario now, it produces exactly the same number of follow-ups as the chronic disease scenario. That is no coincidence – as we shall see, it is driven by exactly the same numbers.
The first stage in the pathway is first outpatients, where demand is set to rise by 5 per cent, and because activity is set to match demand it also rises by 5 per cent. Follow-ups are then at the second stage in the modelled pathway, so demand for them also goes up by 5 per cent. The remaining numbers in the follow-up service are again the same as in the chronic disease scenario, and so we get the same answer: 975.
Finally let’s look at daycases in the clinical pathway scenario. We start with past activity of 500 (with no change in list size in this example). This service also inherits 5 per cent demand growth from the increase in first outpatient activity, and then we have a further ‘increase’ of -14 patients (i.e. a decrease) knocking-on from the follow-up backlog clearance. So the numbers work out as:
500 demand + 5% growth – 14 converting from changes in follow-ups
= 500 * 1.05 – 14
= 511
When you run Gooroo Planner with your own data, you may be running more complex scenarios, with waiting lists and removals for the first outpatient and daycase services, different lengths of past and future period, and other things… but don’t worry because Gooroo Planner can handle all those things with ease.
And there we have it. A straightforward alternative to modelling follow-ups as full-blown waiting list services, and a simpler way of representing a typically complex clinical pathway.
Anything to look out for?
Did we lose anything in our simplification? Perhaps a little accuracy in estimating the conversions from follow-ups to daycases, and (when we look at the week-by-week profiles in Gooroo Planner) a loss of precision about which weeks those patients will convert in.
But in most cases these will not be important – at any rate they are likely to be smaller than other uncertainties in our assumptions. So this straightforward approach is a big improvement on not modelling follow-up waits at all.
There is one final thing that we should remember whenever we use FutExtraDem, which comes into play when we roll a model forwards or backwards in time to create a second model. We are using FutExtraDem to reflect a backlog clearance that only needs doing once, so our FutExtraDem numbers should only appear in one of those models.
When rolling a model forward or backward in time, in Gooroo Planner,
remember that backlog clearances only happen once,
so FutExtraDem should only appear in one of those models.
So if we have run a backlog clearance model, and then want to roll it forward to keep up with demand in the following year, we need to remember to update the rolled-forward dataset with FutExtraDem = 0 so that the backlog clearance is not repeated. Similarly if we have run an “achieve targets throughout” model, and want to roll it backward to model the backlog clearance needed to get there, then we need to remember only to upload the FutExtraDem figures into the second (backlog clearance) dataset.
Support
As always, we are here to support you as you use your Gooroo Planner licences. Just email [email protected] whenever you need some help or advice.