

The NHS ramped up admissions in November to hold the line on 18-week waits, but it wasn’t enough to shrink the waiting list and there were even signs of a slight deterioration against the main 18 week standard (though the slippage was too small and too early to call a trend).
It would not be surprising if hospitals were finding it harder to sustain 18 weeks, because the waiting list has grown a lot compared with recent years. Other things being equal, a bigger list means longer waits.
But other things are not equal: waiting times also depend on the order in which patients are treated, and on whether the NHS can allocate resources effectively to avoid waiting times from ballooning in some areas and evaporating in others. The new “incomplete pathways” target, which deters hospitals from building up backlogs of long-waiting patients, has been helpful in improving the incentives and holding waiting times down (although unfortunately other targets are also being enforced which have the opposite effect).
The number of Trusts reporting one-year-waiters continued to fall, although we have no idea how many one-year-waiters there were in England because two of the Trusts with the longest waits (The Whittington, and Barnet and Chase Farm) did not report their data.
In the following analysis, all figures come from NHS England. If you have a national statistic that you’d like to check up on, you can download our Gooroo NHS waiting times fact checker
England-wide picture
The waiting list shrank in November, which is usual for the time of year. The waiting list remains much larger than in previous years and the gap is roughly steady.
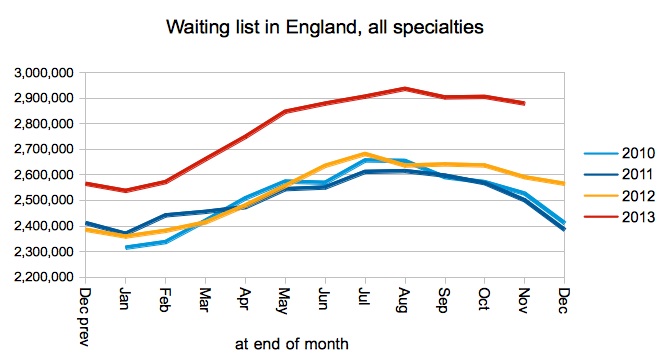
Waiting list size in England
Inpatient and daycase admissions per working day rose sharply in November which may be a sign that the NHS increased activity in the run-up to winter to clear some of the backlog that has built up. Unfortunately, as we have seen in the waiting list chart above, it has not been enough to bring the waiting list back into line with recent years.
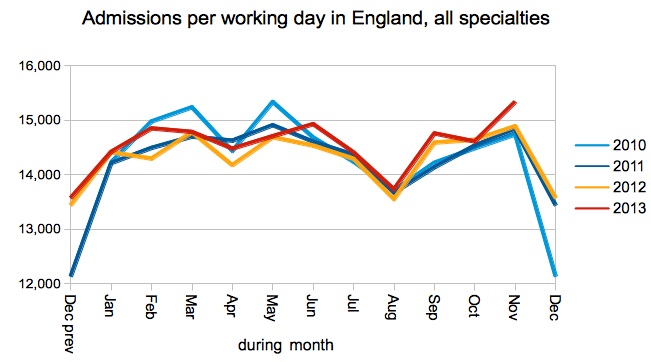
Admissions per working day
The apparent improvement in one-year-waits is not real, because two Trusts did not report data. One of them, Barnet and Chase Farm, last reported 182 one-year-waiters in September.
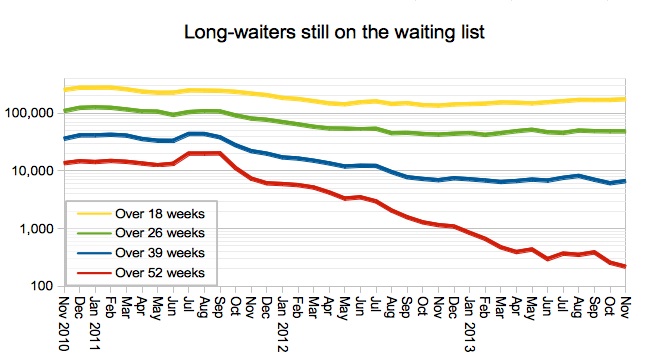
Long-waiters still on the waiting list
The main contractual standard for NHS providers is that 92 per cent of the waiting list should be within 18 weeks. Since April, the 92 per cent mark has been creeping up slightly, and it rose again in November from 16.6 to 16.7 weeks, which is the highest since March 2012. But the rise is slight, and gradual, and it’s too early to declare a trend.
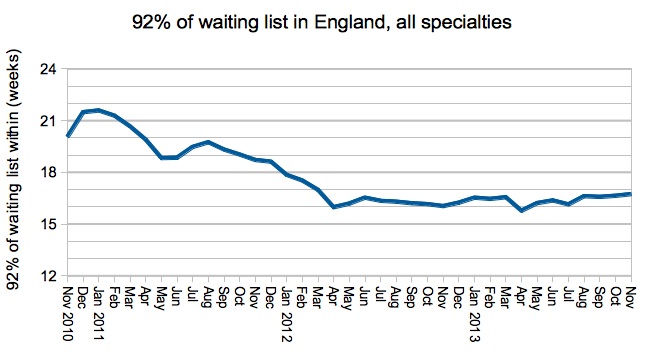
92pc of waiting list within weeks
At specialty level, Orthopaedics was so close to succeeding, but in the end fell just below the 92% target at 91.992% (which is only 33 patients below target on a specialty list of nearly 400,000 patients). Cardiothoracic Surgery showed a dramatic improvement, but (together with Neurosurgery and Plastics) did not achieve the standard.
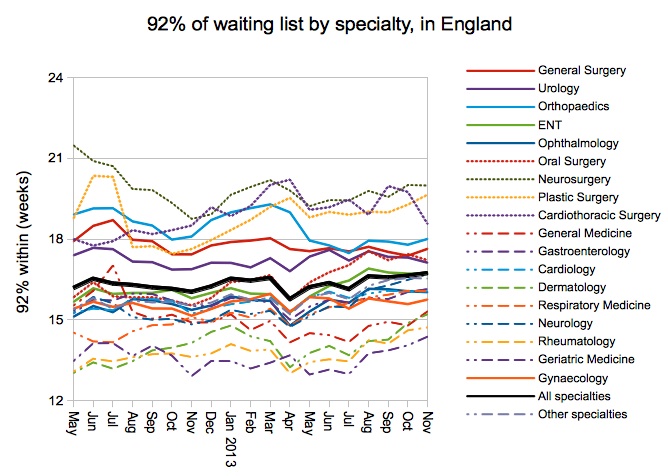
92pc of waiting list by specialty
There was a small decline in the proportion of specialties achieving the main target. This proportion has remained steady in the range 84-88% since May 2012; it has now dropped slightly to 84.9% (the lowest since September 2012) but again the drop is slight.
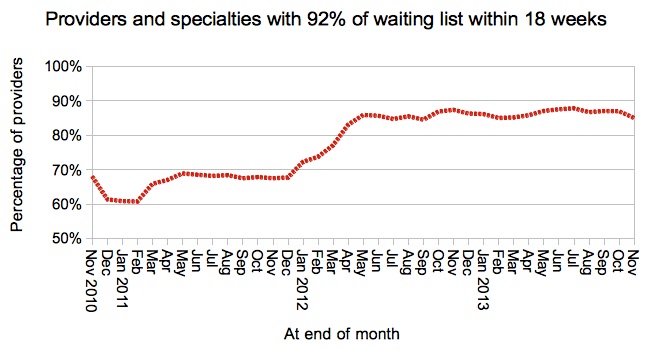
Provider-specialties within 18 weeks
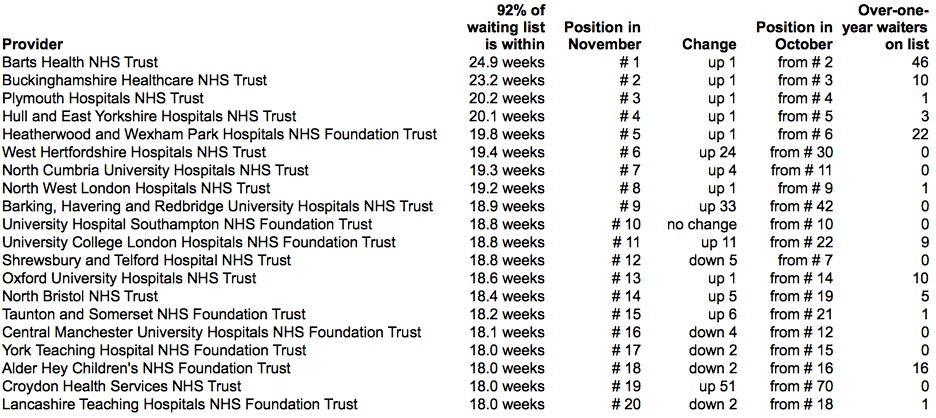
Provider top twenty
Although the declines in performance have been small, more providers are now failing to keep 92 per cent of the waiting list within 18 weeks. So I have decided to turn the “top ten” table back into a “top twenty”.
The good news is that the number of Trusts reporting any one-year waiters fell in November from 49 to 38 (though we should probably add the two Trusts who did not report data). Only one Independent Sector provider reported any one-year-waiters: Fitzwilliam Hospital had one.
Congratulations to Kent Community Health NHS Trust for dropping out of the top twenty in spectacular style. In November they reduced the number of over-18-week waiters from 379 to 21, brought 92nd centile waits down from 25 weeks to 11 weeks, and dropped from 1st on the table to 194th. This looks like the result of a large waiting list validation exercise, as the patients do not show up in the admitted or non-admitted data (which does suggest they could have avoided reaching the top slot at all, if they had been validating patients continuously as they passed, say, the 12 week RTT mark).
Top twenty
The December 2013 data is due out at 9:30am on Thursday 13 February 2014.